App developers today face a challenging mobile app economy. With over 2 million apps available between Google and Apple’s app store, and over 110 billion app downloads, competition for has never been more fierce.
We took a close look at app download trends across the world to make sense of how acute the problem is. Research on the InMobi network for apps downloaded in Q2 2014, between 1st April and 30th June shows some interesting patterns.
App crazy nations

USA and China top the charts at 18% and 10% respectively in terms of share of app downloads. With its high smartphone penetration and a vibrant developer community, US leads the pack. China, despite being a late smartphone adopter is growing quickly fueled by its home-grown brands of mobile phones and the iPhone.
What’s the cost of an app download
For an app developer looking to acquire users, the cost of every app download or Cost Per Install (CPI) can add up very quickly. While the market determines CPIs, how much a developer is willing to pay depends on the expected lifetime value (LTV) of the user. Higher the LTV, higher will be the willingness of the develop to pay for a high CPI.
CPI varies across countries and app categories. Indexed against the average CPI on our network, France is the most expensive amongst the top 10 app download nations with a CPI Index of 176. Malaysia and Indonesia are the cheapest with a CPI index of 42. While US has the highest share of downloads, it also makes for an expensive market. China, India and Indonesia on the other hand hit the sweet spot between cost and share of downloads.

iOS vs Android
When split by operating system, an app download on iOS tends to be more expensive than on Android.

App categories

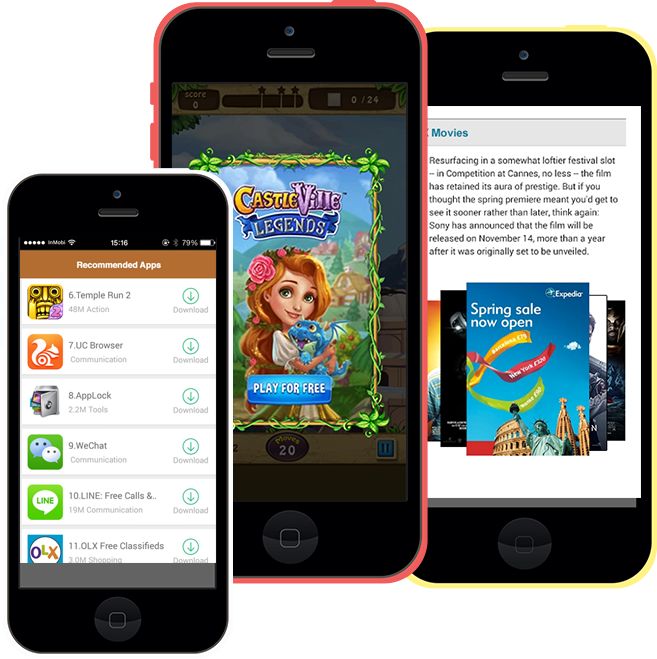
No prizes for guessing the most popular app category amongst users. Games at 64% of app download share was the overwhelming leader. Communication apps weren’t far behind, ranking 2nd with 15 percent share of downloads. Interestingly, Communication apps are most popular in Asia - Malaysia and Indonesia, driven by higher rates of smartphone adoption and need for inexpensive and convenient communication solutions.
Best time for driving app downloads
When looking to build your user acquisition strategy, it is imperative to reach your target audience when they are most active. Our research revealed that apps downloads are highest during weekends with Saturday leading the way. Tuesdays, register the lower percentage of app downloads. Seems like the mid-week crisis hits everyone.

Where are we headed?
Gartner projects 268 billion app downloads annually by 2017. If this does happen, then downloads will grow 2.6 times in the next 4 years. This combined with the rising user acquisition costs makes for an increasingly competitive app market. App developers need to capitalize on this opportunity by investing time and energy to create effective user acquisition and monetization strategies to capitalize on this growing market. Game on !
To learn more about the above study, download The State of Mobile App Downloads report.
Interested in understanding more about this research? Reach out to our insights team at insights@inmobi.com